What is reactive nitrogen and where does it come from?
Nitrogen (N2) is the major gaseous ingredient in the atmosphere and comprises 78.3% by volume of the Earth’s atmosphere. Most of the nitrogen on Earth is found in the biotic environment in the form of amino acids, proteins and DNA. N2 is chemically un-reactive at ambient temperatures and pressures. However, lightning, combustion of fossil fuels and the action of the certain bacteria convert N2 molecules into reactive nitrogen forms that are usable by living organisms. Reactive nitrogen species cycle through the atmosphere, hydrosphere, geosphere and biosphere. Natural nitrogen cycling has beneficial effects for organisms and ecosystems. However, increasing anthropogenic nitrogen fixation has resulted in excess of nitrogen in the wrong places, with subsequent detrimental effects for the environment.
What are the effects of excessive reactive nitrogen?
Humans have drastically increased the amounts of reactive nitrogen in the environment because of the production and use of synthetic fertilizers to achieve increased crop yields. This is beneficial because it has made it possible to produce enough food for a continuously growing population. However, excess nitrogen not used by the plants, pollutes surface and ground water and it is responsible for eutrophication and hypoxia in coastal areas, such as the Gulf of Mexico.
In addition, emissions of gaseous reactive nitrogen species that either volatilize from applied fertilizers or are emitted during combustion of fossil fuels alter the composition of the atmosphere increasing air pollution levels and greenhouse gas effects. Deposition of reactive nitrogen species from the atmosphere contributes to over-fertilization, potentially threatening biodiversity in certain terrestrial and aqueous ecosystems.
Ammonia in the atmosphere
Ammonia (NH3) emitted in the atmosphere reacts with sulfuric and nitric acids to form fine particulate matter, i.e. PM2.5 and PM10 (particles with diameters ≤ 2.5 and 10 μm respectively. These small particles are responsible for adverse health effects and reduced visibility. This is the reason, they are regulated under the Clean Air Act. These fine particles also have a climate cooling effect because they scatter solar radiation. Therefore, it is important to understand their precursor emissions and formation mechanisms.
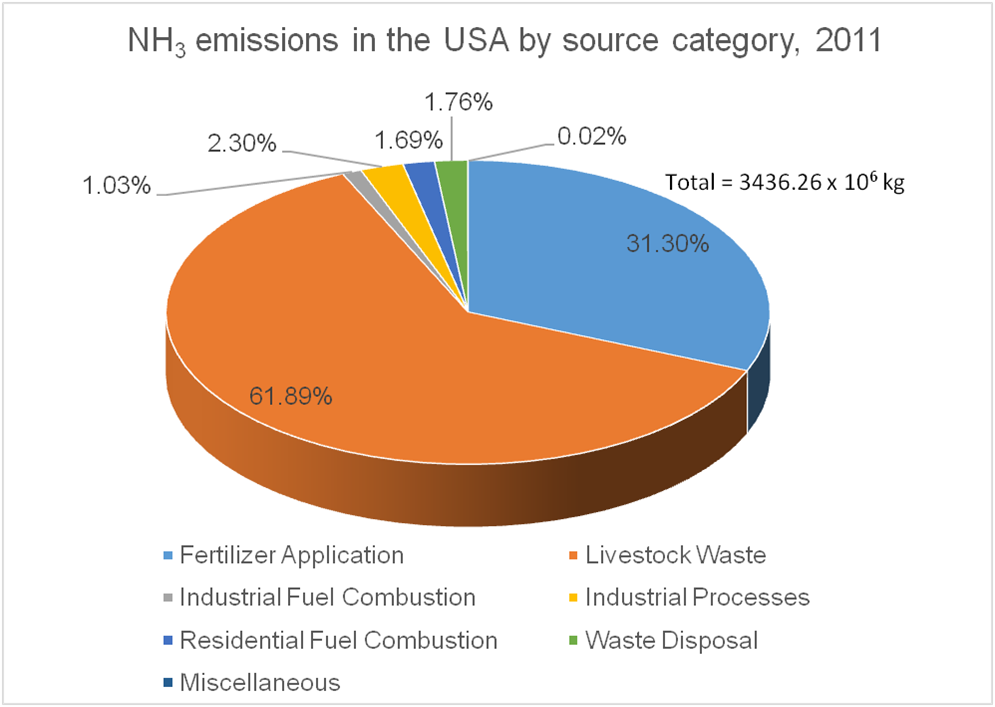
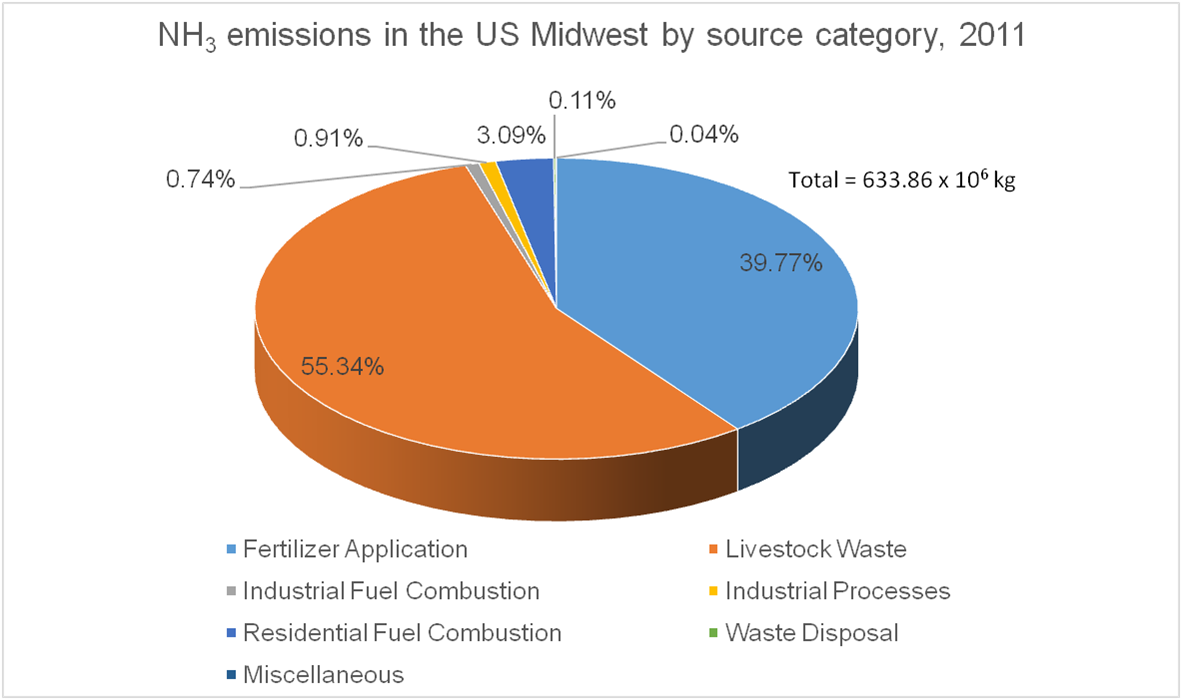
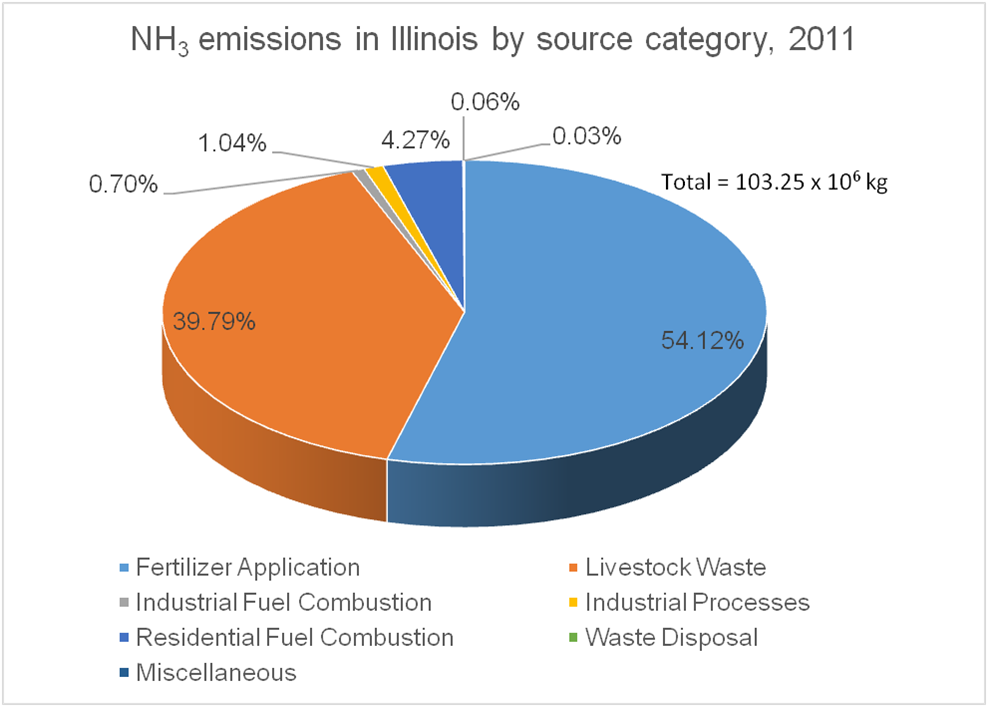
Most of the emissions of NH3 to the atmosphere, in the USA and worldwide, come from agricultural activities. Animal agriculture has the highest contributions with crop agriculture coming second. There is significant variation of ammonia emissions across space and time, depending on the concentration of each type of agricultural activity in an area. For example, whereas on average, the estimated 2011 contribution to NH3 emissions from fertilization of is 31.3 % in the USA, it is 39.8% in the US Midwest, and 54.1% in IL, due to the expansive cultivation of crops with high nitrogen demand such as maize.
Nitrous oxide in the atmosphere
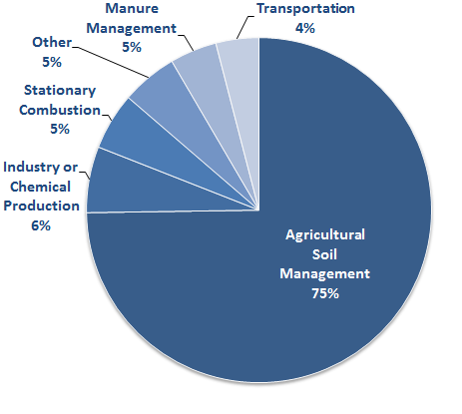
Nitrous oxide (N2O) is product of biogeochemical reactions in the natural environment. Human activities have increased the amount of (N2O) in the atmosphere. This is a concern because (N2O) is a potent greenhouse gas that may persist in the atmosphere for 120 years on average. Human activities that contribute to emissions of (N2O) include fossil fuel combustion, wastewater treatment, biomass burning, industrial processes and agriculture. Fertilizer use for the growth of crops for food and energy production is the most important source.